
Accelerators / Portfolio Intelligence
Underwriting & Portfolio · Accelerator
Know which part of your book is turning, before the quarterly review does
Your policy system and your claims data already hold the answer. Portfolio Intelligence reads across both, inside your own environment, and tells you which segments are moving, why, and what it’s costing you, in plain language, days after it happens instead of a quarter later. Ask it directly, the way you’d ask a colleague, and get an answer grounded in your own data back, instead of a dashboard to figure out yourself.
The problem
The data is there. The time to read it usually isn’t.
Premium sits in one system, claims sit in another, and renewal history sits in a third. Most carriers pull it all into a spreadsheet every month or quarter, rebuild the same pivot tables, and put together a review deck. By the time a segment shows up as a problem in that deck, it’s often been writing at the wrong rate for two or three quarters already.
1
It's scattered across systems
Premium, claims, and renewal data live in places that were never built to talk to each other.
2
Reports look backward
By the time a static report is built, the numbers behind it are already old.
3
Finding the cause takes days
Someone has to dig through claims and rate history to work out what actually happened.
4
The response comes late
The book keeps writing at the old terms until someone acts on it.
Meanwhile the book keeps moving. The gap between when something starts going wrong and when someone notices it is where the real cost sits, and it’s rarely visible until the quarterly review forces the question.
And most tools built to close that gap hand you another dashboard to log into. What underwriting, product, and actuarial teams are actually asking for is simpler: the ability to ask a plain question about the book and get a straight answer back.
How it works
It reads your book and tells you what’s happening, in plain language
Portfolio Intelligence connects to your policy and claims systems with read-only access, nothing to migrate and nothing to rip out. It watches every line and state you write, and when something moves, it tells you what moved, why, and what to do next.
Works with what you already run
Guidewire, Duck Creek, Sapiens, or an in-house system, connected read-only, with nothing to migrate.
Watches continuously
Every line and state you write, not just the handful someone remembers to check.
Traces back to a source
Every figure it shows you can be traced back to the record it came from.
01
Connect
It connects to what you already run
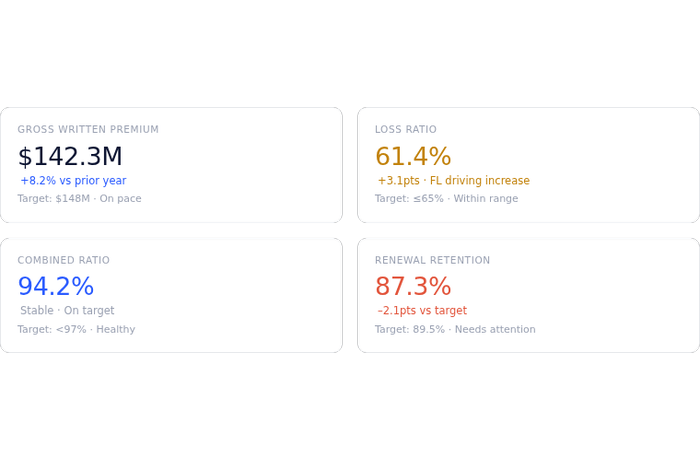
No migration, no new system of record. Portfolio Intelligence reads premium, policy, class code, loss ratio, and renewal data straight from your policy and claims systems, with read-only access under your own security rules.
- Guidewire, Duck Creek, Sapiens, or in-house
- Read-only, nothing to rip out
- Live in days, not a multi-month project
02
Explain
It explains the move, not just the number
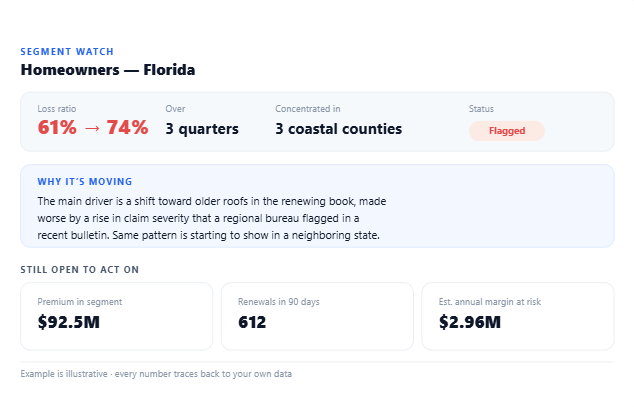
A dashboard can tell you a loss ratio moved five points. Portfolio Intelligence tells you it’s concentrated in three counties, driven by a shift toward older roofs, and made worse by a claims trend a regional bureau flagged, then writes that in a sentence you can hand to your team
03
Ask
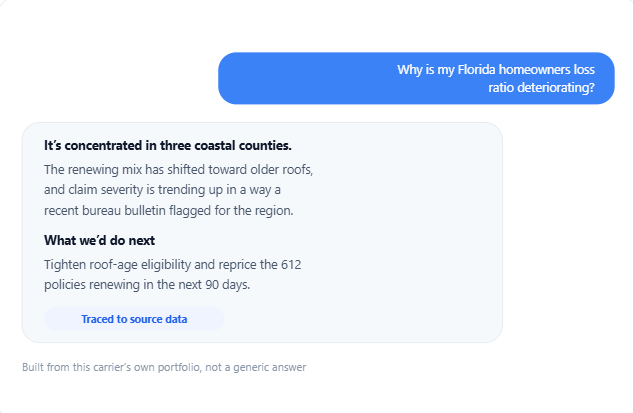
Skip the dashboard. Ask it a question and get an answer grounded in your own data.
Type a plain question, the way you’d ask a colleague, like why is my Florida homeowners loss ratio deteriorating, and get an answer built from your own portfolio and claims history, with the source behind every number.
- Answers are specific to your book, not generic
- Every number traces back to a source
- Follow-up questions keep the same context
04
Act
Act on it without leaving your day
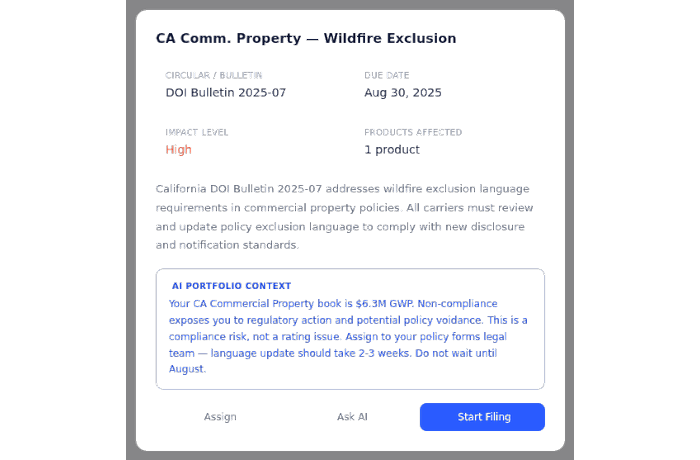
Share a finding with your team, open a ticket with the analysis already filled in, or flag a segment for review, all in one click. It shows up wherever your team already works: a weekly email brief, a chat alert, a ticket, or a spreadsheet sidebar for the team that lives in spreadsheets.
What this changes
Made for underwriting, product, and actuarial teams
For underwriting and product
- You see a drifting segment while there’s still a renewal window left to act on it, not after the quarterly deck is built.
- Every finding is written in plain language, so it’s ready to hand to your team without a translation step.
- You can check any number and trace it back to the record it came from.
For actuarial
- Less time spent assembling and reconciling reports, more time validating the trend and setting rate.
- Movement is broken down by mix, frequency, severity, and rate adequacy, not left as one blended number.
- A regulatory bulletin or a rate change is linked directly to the segment it affected.
For both: it shows up wherever your team already works, an email brief, a chat alert, a ticket, or a spreadsheet, so there’s no new tool to remember to check.
The numbers
What one flagged segment can look like
$92.5M
Premium in segment
Flagged before the next renewal cycle
612
Renewals in 90 days
Still open to reprice or re-underwrite
3
Counties
Where the movement is concentrated
Every
Figure traced
Back to your own policy and claims data
See what your book would show
Book 30 minutes with our team. We’ll run it against a few of your own lines and states and show you what turns up.