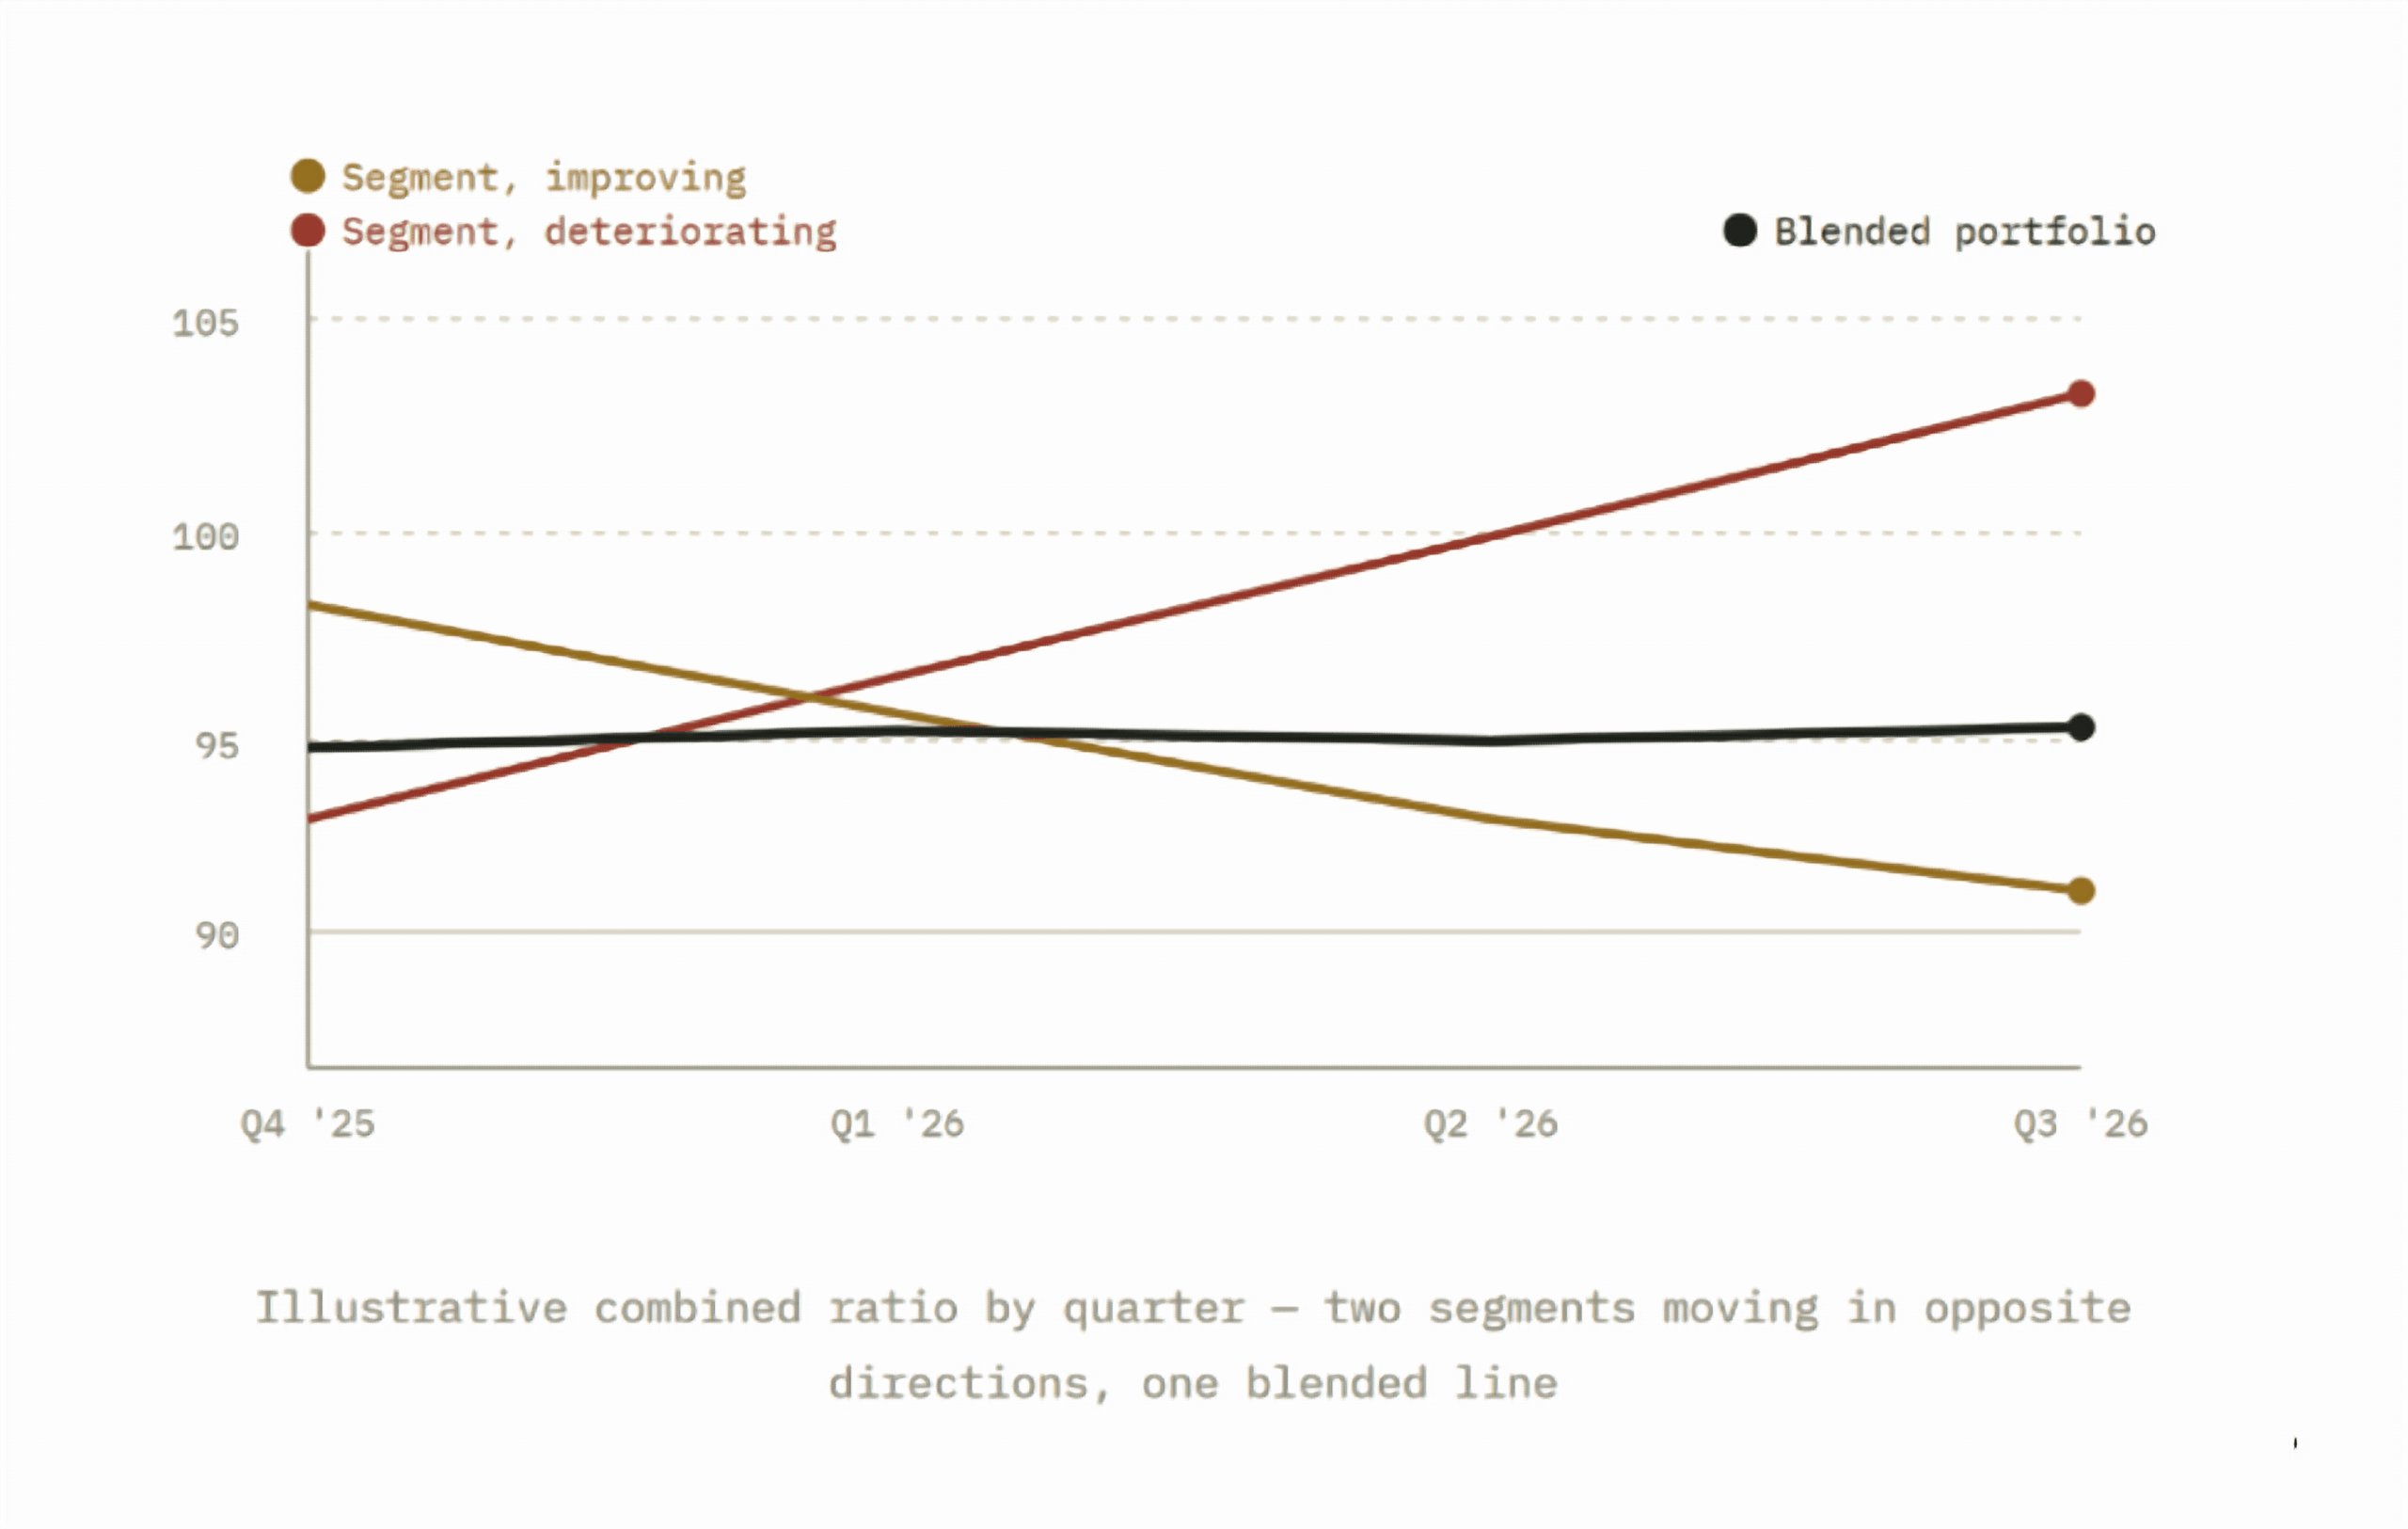
BCG’s 2026 research on commercial P&C portfolio management puts the consequence plainly: risk-quality issues typically only get caught once a large loss has already occurred, and errors in risk selection or pricing compound, unnoticed, across a book until then.
The same mechanic shows up at market scale
Lloyd’s own full-year 2025 results, published in March 2026, are a clean example of it. The headline combined ratio came in at 87.6 percent, a number that reads as stable underwriting performance.
Underneath that headline, the underlying combined ratio, the figure excluding major losses, actually rose to 81.8 percent, up 2.7 points from the year before.
Benign catastrophe experience covered the deterioration in the headline figure. The underlying trend moved the wrong direction the entire time, and the blended number said the opposite.
What the movement alone doesn’t explain
Catching that a specific segment has moved is progress, but on its own it says little. A loss ratio can move for several distinct reasons, and each one calls for a different response:
- A mix shift toward a riskier class or territory, which calls for tightening eligibility going forward.
- A change in claim frequency, which points back to underwriting selection.
- A change in claim severity, which is more often a reserving or trend question than a selection one.
- A rate-adequacy gap that opened upstream, which is a filing and pricing problem rather than an underwriting one.
Two segments can show the identical five-point move for entirely different reasons, and the right response differs completely depending on which one it actually is.
Most reporting stacks stop at the point where the metric is displayed. Working out which of the four is actually driving it typically falls to whoever on the team has the time to dig into it that week.
Why this particular year raises the cost of missing it
A market moving in one direction made this cheaper to miss. A single blended rate trend covered most of the divergence underneath it.
A market splitting by line, the way 2026’s has, removes that cover specifically for any book running more than one or two commercial lines, which is most of them.
This is the specific gap the Portfolio Intelligence work at Insuronix is built around: reading a book by segment rather than in aggregate, and attaching a reason to a movement rather than just a number.